 |
|
|
Home
Dear Clients and Friends,
Welcome to the latest update on the housing market in Seattle and the Central Puget Sound Region. It was a little over fifteen years ago that the first Housing Update letter was written, printed and mailed.
Thanks to the web, distribution of this information has become less expensive, more immediate, and ultimately, easier.
Conversely, during this same time the housing market has become more expensive and increasingly complex.
Zoning grants and environmental restrictions, growth management policies that focus or defuse the intensity of land use, transportation issues that direct buyers to or from specific locations, petrol-politics and their related military conflicts, globalization of businesses, ballooning of the Federal deficit, fluctuations in the mortgage money market, tsunamis in Asia, hurricanes in Florida, in or out migration of population … all have an influence on local real estate markets across the continent.
These Housing Update letters present my research and opinions and are intended to help with your decisions as they pertain to real estate investments and achieving your intended financial goals.
If, in the course of this work, you have a need for broker representation or risk management consulting, please contact me. I welcome the opportunity to be of service.
With nearly 35 years of activity in the real estate business including roles as a broker, appraiser, litigation expert witness, mortgage risk and development consultant, I bring a unique combination of skills and experience to the table.
Bob Rothstein
Now, let's take a look at several components of the Pacific Northwest's housing market.
Financing: Mortgage rates are climbing, but 5 year adjustables are available for 5.4% and 30 year fixed rates are just shy of 6%. These rates should be conducive to keeping the housing market functional, but more rate increases are likely in store.
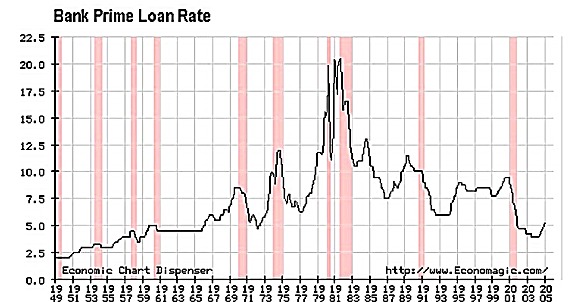
Here's an interesting graph of changes in the prime rate from 1949 to the present. This was compiled from Economagic.com, an interesting financial data web site you might want to view.
The shaded, verticle lines above represent economic recessions. You can observe that recessions often follow increases in the Fed's prime rate.
Mortgage rate trends reportedly have relatively long cycles, and there’s pressure from the IMF for the Fed to increase rates. As such, I think we can expect a continual rise in interest rates for home loans for some time to come. This might be cause for concern for borrowers who have "stripped" equity from their residences using home equity lines of credit as these usually come with 'floater' rates which can become burdensome as rates rise.
Single Family Residential Re-Sale Volumes & Prices: The table that follows details the change in sale volumes and median prices, by county, for re-sale single family dwellings (SFD’s). The data tracks changes from calendar year 2003 to c/y 2004. I'm pleased to say that from the macro perspective, the overall market moved in a positive direction.
Note, however, that regional real estate markets rarely move as a monolith. The 'market' is actually comprised of hundreds of sub-markets. Sub-markets can be property types (single family vs. condos), new or re-sale housing, prices ranges, neighborhoods, and so forth. Along with this complexity comes varying degrees of investment risk as some sub-markets have out-performed the averages while others failed to keep pace.
Based upon other recent research, it appears, at this time, that much of the housing market is improving from the bottom up, price-wise. This is an important dynamic for the long-term health of the market. Since few market participants move from a $300,000 home directly into a $3,000,000 property, soft spots in the middle price ranges can create risk for lenders serving the high end housing market. Rapid increases in higher priced segments of the market without similar increases in the price ranges beneath them can create a "top-heavy" scenario, which creates inordinately high risk for lenders and would not bode well for the overall housing economy. There is already some of evidence of this dynamic at play in the market. HIGH RISK SUB-MARKETS: I have found a few potential "bubbles" surfacing that might be worth further investigation if you are actively engaged in financing, developing or acquiring high end housing. Recent studies of King County’s single family inventory priced at $750,000 and above shows radical differences both in market strength and price performance. Please contact me if you have an interest in obtaining that research for Seattle or any other US market you serve.
Market Strength Indexes: The following graph shows the Market Strength Index (MSI) for single family houses in the urban Seattle market over the past several years. This patented index can be viewed as being similar to a “Dow Jones,” but for specific regional real estate markets or sub-markets within the region, rather than an index for the national securities market. This is a supply/demand index where a high demand factor and a low supply factor will push the index up. For purposes of our discussion, the higher the index rating, the greater the market strength.

Consistent with the data from the Price/Sale Volume table above, the Market Strength Index graph shows general improvement over the past year.
Although the above graph and table indicate that the region is coming out of the economic contraction of the past several years, we are by no means in a state of significant economic growth and still remain vulnerable to deleterious forces like the expected interest rate hikes or possible downturns in employment and tourism, for example. Condominiums: For the five-county, Central Puget Sound region, calendar year 2004 showed about 12,560 units closed, a healthy 18.5% increase in condo sale volume over 2003. The following table details statistics for price and marketing times for a one year data sample taken from 2/03 to 2/04 in the three locational sub-markets identified. Collectively, these areas account for about 25% of the condo sale activity in the five-county regional market.
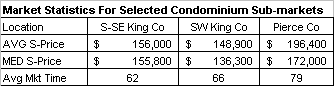
The bar graph below depicts the relative strength of these three sub-markets.
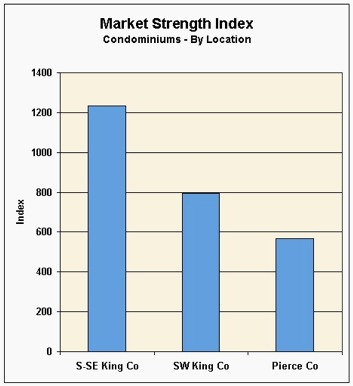
This data points to the fact that there is a weaker condo market in Pierce County than in South King County. This inherently reflects greater risk of loss to mortgage investors in the Pierce County condo market. That is to say that if a borrower loses the ability to repay the mortgage, there is a significantly higher probability of the lender, rather than the market, absorbing the Pierce County condo, as compared to one in S-SE King County. This brings us to the close of our latest Housing Update. Please note that this is a generalized perspective on market conditions. I encourage you to contact me if you have a need for more detailed research on mortgage or development risk for the residential real estate sub-markets you are targeting for investment. Allow me to express thanks to my real estate brokerage and consulting clients for years of continued support. Your comments and questions on this material are welcome. Regards,
Bob Rothstein
|
|
| ©1999-2005 R.E. Rothstein, All Rights Reserved | |