 |
|
|
Home
Between Sale Price And Marketing Time March 31, 2006
Following my most recent Housing Update letter, the opportunity has arisen to continue the discussion of market dynamics with clients, real estate professionals, and others with an interest in housing market activity. As a result, I offer the research and comments below regarding the relationship between the eventual sale price and the time a property spends on the market. This work shows both a subtle and potentially costly correlation. I examined a large sample of sales of single family houses with the following parameters: * Located in King and Snohomish Counties, * Priced between $450,000 and $900,000 (to examine the segment of the market above the median of approximately $450k but staying out of million+ dollar inventory), * Closed between July 1, 2005 and March 21,2006 (a more stable market after the first quarter '05 market spike), * Built between 1993 and 2003 (to exclude properties that might be in need of refurbishing or, conversely, new construction, where an extended period of time might be logged, depending upon the point during the construction process the house was listed), * Situated on lots of 4,000 to 20,000 square feet (to eliminate the influence of excess land on prices), * With houses containing between 2,000 and 5,000 square feet (mid-market housing stock).
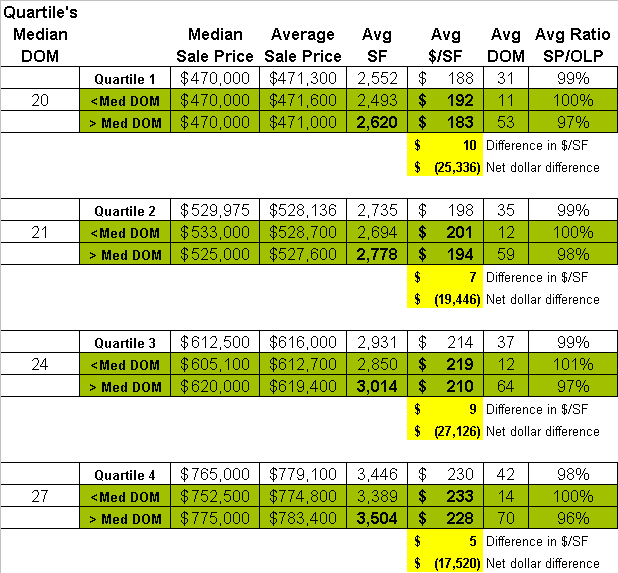
There were 926 property sales extracted from the MLS database matching these criteria. The overall average sale price was $661,400 and the median was $570,000. The average days on market (DOM) was 36, the median, 22 days. Included in the DOM calculation were any listings where the sold property showed a recently expired or cancelled listing. For instance, if a property showed that it sold in 30 days but also had a recent listing that had expired after 50 days on the market, the marketing time was counted as 80 days for that home. For the summary table below, the sales were first sorted by price then divided into quartiles (some 230 properties in each quartile). The quartiles were then divided into two groups based upon their marketing times, using the median DOM as the point of division within each quartile.

Examining the two lower priced quartiles, as we compare the However, several other items of significance arise in this data. First, the price per square foot of living area decreases for each of the four 1/2 quartiles with longer marketing times when compared to the similarly priced group with the shorter marketing times (Avg DOM). Second, the average square footage figures for the longer-marketed groups are consistently larger than those that sold in the shorter time periods. I would interpret this as the need for sellers of those properties that spend too much time on the market to deliver more in order to entice their buyers into the transaction. Further, if we calculate the difference in the price per square foot (Avg $/SF) for each 1/2 quartile, then multiply that by the square footage of the slower moving inventory, we see highlighted in yellow what is labeled as the "Net dollar difference." I propose that a portion, if not all of this figure is the true cost of spending too much time on the market for this particular group of sales. As shown with the figures in yellow highlight, this ranges from $17,500 to $27,100, depending upon the price range. It could be argued that the smaller square footage houses would produce a higher price per square foot. However, the amount of difference in the square footages between the two groups within each quartile is not sufficient to create these differences in $/SF, and when I tested the data to identify a direct correlation between sale price and size, the slope of the graph lines did not match. As such, we get back to time on the market as the primary determinant, here. There are two more items worth noting. You will see that the average marketing times for the faster selling groups produce results in 1.5 to 2 weeks of market exposure while the longer-marketed groups range from 8 to 10 weeks of exposure. This is a big difference in how efficiently you spend your time, as either a broker or a property owner. What is not significantly different is the data from the last column to the right in the table, the average ratio of sale price: original list price (Avg Ratio SP/OLP). This ranges from 2% to 4% for the slower moving inventory. After decades in this industry, I can tell you that it is difficult for even seasoned real estate professionals to consistently forecast a sale price within these tolerances. Accordingly, what we can do is be critical with our initial price targets, and more critical with advising clients about how their property is being viewed by the marketplace, with special emphasis on timing. One last item; due to the age of the inventory studied, the comments above address a mostly suburban scenario. Other sub-markets can exhibit very different, and occasionally, more expensive consequences for extended periods of market exposure. As always, your comments and questions are welcomed. Regards,
Robert Rothstein
Previous Housing Update Letter
|
|
| ©2006 R.E. Rothstein, All Rights Reserved | |